Sample Size Calculator

Find Out The Sample Size
This calculator computes the minimum number of necessary samples to meet the desired statistical constraints.
Find Out the Margin of Error
This calculator gives out the margin of error or confidence interval of observation or survey.
In statistics, information is often inferred about a population by studying a finite number of individuals from that population, i.e. the population is sampled, and it is assumed that characteristics of the sample are representative of the overall population. For the following, it is assumed that there is a population of individuals where some proportion, p, of the population is distinguishable from the other 1-p in some way; e.g., p may be the proportion of individuals who have brown hair, while the remaining 1-p have black, blond, red, etc. Thus, to estimate p in the population, a sample of n individuals could be taken from the population, and the sample proportion, p̂, calculated for sampled individuals who have brown hair. Unfortunately, unless the full population is sampled, the estimate p̂ most likely won't equal the true value p, since p̂ suffers from sampling noise, i.e. it depends on the particular individuals that were sampled. However, sampling statistics can be used to calculate what are called confidence intervals, which are an indication of how close the estimate p̂ is to the true value p.
Statistics of a Random Sample
The uncertainty in a given random sample (namely that is expected that the proportion estimate, p̂, is a good, but not perfect, approximation for the true proportion p) can be summarized by saying that the estimate p̂ is normally distributed with mean p and variance p(1-p)/n. For an explanation of why the sample estimate is normally distributed, study the Central Limit Theorem. As defined below, confidence level, confidence intervals, and sample sizes are all calculated with respect to this sampling distribution. In short, the confidence interval gives an interval around p in which an estimate p̂ is "likely" to be. The confidence level gives just how "likely" this is – e.g., a 95% confidence level indicates that it is expected that an estimate p̂ lies in the confidence interval for 95% of the random samples that could be taken. The confidence interval depends on the sample size, n (the variance of the sample distribution is inversely proportional to n, meaning that the estimate gets closer to the true proportion as n increases); thus, an acceptable error rate in the estimate can also be set, called the margin of error, ε, and solved for the sample size required for the chosen confidence interval to be smaller than e; a calculation known as "sample size calculation."
Confidence Level
The confidence level is a measure of certainty regarding how accurately a sample reflects the population being studied within a chosen confidence interval. The most commonly used confidence levels are 90%, 95%, and 99%, which each have their own corresponding z-scores (which can be found using an equation or widely available tables like the one provided below) based on the chosen confidence level. Note that using z-scores assumes that the sampling distribution is normally distributed, as described above in "Statistics of a Random Sample." Given that an experiment or survey is repeated many times, the confidence level essentially indicates the percentage of the time that the resulting interval found from repeated tests will contain the true result.
| Confidence Level | z-score (±) |
| 0.70 | 1.04 |
| 0.75 | 1.15 |
| 0.80 | 1.28 |
| 0.85 | 1.44 |
| 0.92 | 1.75 |
| 0.95 | 1.96 |
| 0.96 | 2.05 |
| 0.98 | 2.33 |
| 0.99 | 2.58 |
| 0.999 | 3.29 |
| 0.9999 | 3.89 |
| 0.99999 | 4.42 |
Confidence Interval
In statistics, a confidence interval is an estimated range of likely values for a population parameter, for example, 40 ± 2 or 40 ± 5%. Taking the commonly used 95% confidence level as an example, if the same population were sampled multiple times, and interval estimates made on each occasion, in approximately 95% of the cases, the true population parameter would be contained within the interval. Note that the 95% probability refers to the reliability of the estimation procedure and not to a specific interval. Once an interval is calculated, it either contains or does not contain the population parameter of interest. Some factors that affect the width of a confidence interval include: size of the sample, confidence level, and variability within the sample.
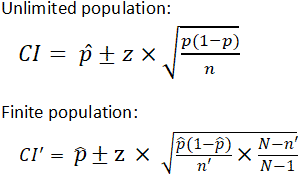
There are different equations that can be used to calculate confidence intervals depending on factors such as whether the standard deviation is known or smaller samples (n<30) are involved, among others. The calculator provided on this page calculates the confidence interval for a proportion and uses the following equations:
|
where
z is z score p̂ is the population proportion n and n' are sample size N is the population size |
Within statistics, a population is a set of events or elements that have some relevance regarding a given question or experiment. It can refer to an existing group of objects, systems, or even a hypothetical group of objects. Most commonly, however, population is used to refer to a group of people, whether they are the number of employees in a company, number of people within a certain age group of some geographic area, or number of students in a university's library at any given time.
It is important to note that the equation needs to be adjusted when considering a finite population, as shown above. The (N-n)/(N-1) term in the finite population equation is referred to as the finite population correction factor, and is necessary because it cannot be assumed that all individuals in a sample are independent. For example, if the study population involves 10 people in a room with ages ranging from 1 to 100, and one of those chosen has an age of 100, the next person chosen is more likely to have a lower age. The finite population correction factor accounts for factors such as these. Refer below for an example of calculating a confidence interval with an unlimited population.
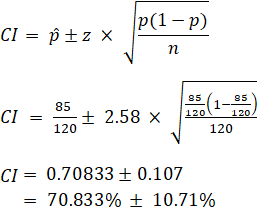
EX: Given that 120 people work at Company Q, 85 of which drink coffee daily, find the 99% confidence interval of the true proportion of people who drink coffee at Company Q on a daily basis.
Sample Size Calculation
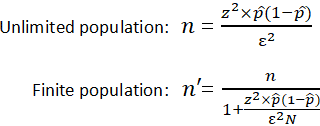
Sample size is a statistical concept that involves determining the number of observations or replicates (the repetition of an experimental condition used to estimate the variability of a phenomenon) that should be included in a statistical sample. It is an important aspect of any empirical study requiring that inferences be made about a population based on a sample. Essentially, sample sizes are used to represent parts of a population chosen for any given survey or experiment. To carry out this calculation, set the margin of error, ε, or the maximum distance desired for the sample estimate to deviate from the true value. To do this, use the confidence interval equation above, but set the term to the right of the ± sign equal to the margin of error, and solve for the resulting equation for sample size, n. The equation for calculating sample size is shown below.
|
where
z is the z score ε is the margin of error N is the population size p̂ is the population proportion |
EX: Determine the sample size necessary to estimate the proportion of people shopping at a supermarket in the U.S. that identify as vegan with 95% confidence, and a margin of error of 5%. Assume a population proportion of 0.5, and unlimited population size. Remember that z for a 95% confidence level is 1.96. Refer to the table provided in the confidence level section for z scores of a range of confidence levels.
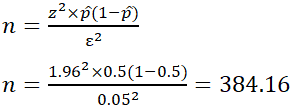
Thus, for the case above, a sample size of at least 385 people would be necessary. In the above example, some studies estimate that approximately 6% of the U.S. population identify as vegan, so rather than assuming 0.5 for p̂, 0.06 would be used. If it was known that 40 out of 500 people that entered a particular supermarket on a given day were vegan, p̂ would then be 0.08.