Mean, Median, Mode, Range Calculator
Please provide numbers separated by comma to calculate.
Mean
The word mean, which is a homonym for multiple other words in the English language, is similarly ambiguous even in the area of mathematics. Depending on the context, whether mathematical or statistical, what is meant by the "mean" changes. In its simplest mathematical definition regarding data sets, the mean used is the arithmetic mean, also referred to as mathematical expectation, or average. In this form, the mean refers to an intermediate value between a discrete set of numbers, namely, the sum of all values in the data set, divided by the total number of values. The equation for calculating the arithmetic mean is virtually identical to that for calculating the statistical concepts of population and sample mean, with slight variations in the variables used:
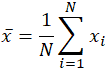
The mean is often denoted as x̄, pronounced "x bar," and even in other uses when the variable is not x, the bar notation is a common indicator of some form of the mean. In the specific case of the population mean, rather than using the variable x̄, the Greek symbol mu, or μ, is used. Similarly, or rather confusingly, the sample mean in statistics is often indicated with a capital X̄. Given the data set 10, 2, 38, 23, 38, 23, 21, applying the summation above yields:
|
= |
|
= 22.143 |
As previously mentioned, this is one of the simplest definitions of the mean, and some others include the weighted arithmetic mean (which only differs in that certain values in the data set contribute more value than others), and geometric mean. Proper understanding of given situations and contexts can often provide a person with the tools necessary to determine what statistically relevant method to use. In general, mean, median, mode and range should ideally all be computed and analyzed for a given sample or data set since they elucidate different aspects of the given data, and if considered alone, can lead to misrepresentations of the data, as will be demonstrated in the following sections.
Median
The statistical concept of the median is a value that divides a data sample, population, or probability distribution into two halves. Finding the median essentially involves finding the value in a data sample that has a physical location between the rest of the numbers. Note that when calculating the median of a finite list of numbers, the order of the data samples is important. Conventionally, the values are listed in ascending order, but there is no real reason that listing the values in descending order would provide different results. In the case where the total number of values in a data sample is odd, the median is simply the number in the middle of the list of all values. When the data sample contains an even number of values, the median is the mean of the two middle values. While this can be confusing, simply remember that even though the median sometimes involves the computation of a mean, when this case arises, it will involve only the two middle values, while a mean involves all the values in the data sample. In the odd cases where there are only two data samples or there is an even number of samples where all the values are the same, the mean and median will be the same. Given the same data set as before, the median would be acquired in the following manner:
2,10,21,23,23,38,38
After listing the data in ascending order, and determining that there are an odd number of values, it is clear that 23 is the median given this case. If there were another value added to the data set:
2,10,21,23,23,38,38,1027892
Since there are an even number of values, the median will be the average of the two middle numbers, in this case, 23 and 23, the mean of which is 23. Note that in this particular data set, the addition of an outlier (a value well outside the expected range of values), the value 1,027,892, has no real effect on the data set. If, however, the mean is computed for this data set, the result is 128,505.875. This value is clearly not a good representation of the seven other values in the data set that are far smaller and closer in value than the average and the outlier. This is the main advantage of using the median in describing statistical data when compared to the mean. While both, as well as other statistical values, should be calculated when describing data, if only one can be used, the median can provide a better estimate of a typical value in a given data set when there are extremely large variations between values.
Mode
In statistics, the mode is the value in a data set that has the highest number of recurrences. It is possible for a data set to be multimodal, meaning that it has more than one mode. For example:
2,10,21,23,23,38,38
Both 23 and 38 appear twice each, making them both a mode for the data set above.
Similar to mean and median, the mode is used as a way to express information about random variables and populations. Unlike mean and median, however, the mode is a concept that can be applied to non-numerical values such as the brand of tortilla chips most commonly purchased from a grocery store. For example, when comparing the brands Tostitos, Mission, and XOCHiTL, if it is found that in the sale of tortilla chips, XOCHiTL is the mode and sells in a 3:2:1 ratio compared to Tostitos and Mission brand tortilla chips respectively, the ratio could be used to determine how many bags of each brand to stock. In the case where 24 bags of tortilla chips sell during a given period, the store would stock 12 bags of XOCHiTL chips, 8 of Tostitos, and 4 of Mission if using the mode. If, however, the store simply used an average and sold 8 bags of each, it could potentially lose 4 sales if a customer desired only XOCHiTL chips and not any other brand. As is evident from this example, it is important to take all manners of statistical values into account when attempting to draw conclusions about any data sample.
Range
The range of a data set in statistics is the difference between the largest and the smallest values. While range does have different meanings within different areas of statistics and mathematics, this is its most basic definition, and is what is used by the provided calculator. Using the same example:
2,10,21,23,23,38,38
38 - 2 = 36
The range in this example is 36. Similar to the mean, range can be significantly affected by extremely large or small values. Using the same example as previously:
2,10,21,23,23,38,38,1027892
The range, in this case, would be 1,027,890 compared to 36 in the previous case. As such, it is important to extensively analyze data sets to ensure that outliers are accounted for.